Source: 2024 to 2034 Michigan Statewide Long-Term Employment Projections, Michigan Center for Data and Analytics
Financial Activities and Professional and Business Services Follow Education and Health Services in Driving Expected Job Gains
Education and health services – the supersector leading employment share growth – has by far the highest anticipated job gains (+60,200) and rate of growth (+5.6 percent) statewide. Its sizeable advance is consistent with the nation, where it is expected to expand at a rate of 5.2 percent. However, a look at its underlying subgroups reveals diverging trends.
Growth in Michigan’s Education and health services supersector is dominated by healthcare. All four subsectors within Healthcare and social assistance lead the supersector in growth. This includes Hospitals (+25,700), Ambulatory health care services (+22,570), Social assistance (+9,900), and Nursing and residential care facilities (+8,110). By contrast, Educational services is expected to contract by 6,070 jobs.
Two other supersectors expected to post substantial employment gains are Financial activities and Professional and business services. Financial activities is projected to add 10,330 jobs by 2034, exhibiting a growth rate of 4.4 percent, the second greatest across the state over the decade. Its Real estate (+6,140) and Insurance carriers and related activities (+3,330) subsectors contribute over 90 percent of the supersector’s job growth. More than half of the subsectors in Financial activities are projected to have virtually no employment change.
Professional and business services is the supersector with the third largest contributor of jobs in the state (+8,430), and fourth largest by growth rate (+1.3 percent). Its rise is led by the Professional, scientific, and technical services subsector (+12,870), with all but one of the remaining subsectors expected to contract. The only other subsector projected to add employment in the supersector is Waste management and remediation services, at just 490 new jobs over the decade.
Although not contributing a high volume of jobs, the remaining growing industry supersectors – Construction (+1.8 percent) and Natural resources and mining (+0.5 percent) – are both predicted to advance at a faster rate than the state as a whole (+0.4 percent). Combined, these two supersectors are expected to generate 3,630 new jobs over the decade.
Manufacturing is Projected to Shed the Most Jobs Among Michigan's Industry Supersectors
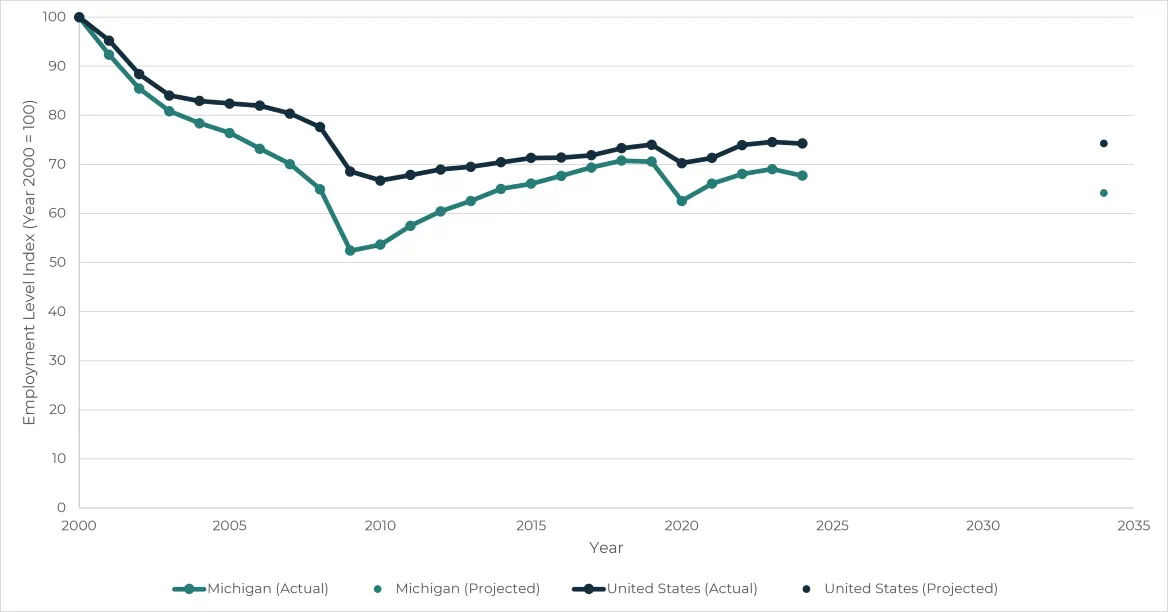
Largely offsetting the employment growth gains of these five industry supersectors are losses in the remaining six, particularly Manufacturing. Looking at projected jobs lost from 2024 to 2034, the anticipated drop in Manufacturing is notable, with an expected numeric loss of 31,120 (-5.2 percent), more than the next three supersectors combined. This is unlike Manufacturing nationwide, where employment is expected to remain flat over the decade. This is in line with trends since the turn of the millennium, a period in which Michigan consistently lagged the nation in Manufacturing employment. From 2000 to 2024, Michigan lost 32.3 percent of its Manufacturing jobs, compared to 25.8 percent for the U.S.2
Michigan Manufacturing employment is expected to continue underperforming relative to the U.S. from 2024 to 2034.
Source: 2024 to 2034 Michigan Statewide Long-Term Employment Projections, Michigan Center for Data and Analytics; Current Employment Statistics, U.S. Bureau of Labor Statistics
View/Download Data Table
Within Manufacturing, job losses are concentrated in the Transportation equipment manufacturing subsector, with an expected decline of 21,840 jobs (-12.0 percent). This is followed by Fabricated metal product manufacturing (-7,050) and Machinery manufacturing (-6,770). All three subsectors have strong ties to Michigan's automotive sector. Just eight of Manufacturing’s 21 subsectors are expected to gain employment.
As with Manufacturing, the Trade, transportation, and utilities supersector is projected to contract markedly, losing 16,840 jobs, placing it second by jobs lost and third by relative change (-2.1 percent). The industry’s projected job loss is concentrated within several declining subsectors, with the five largest being in retail. These include Clothing, clothing accessories, shoe, and jewelry retailers (-5,700); Food and beverage retailers (-5,070); and Gasoline stations and fuel dealers (-4,550). Just over half of the 24 subsectors in Trade, transportation, and utilities are expected to lose jobs.
Leisure and hospitality posts the third largest predicted numeric job decline (-7,480) and fourth largest relative decline (-1.8 percent) among Michigan supersectors. This retreat is overwhelmingly attributable to the Food services and drinking places (-9,680) subsector. The Performing arts, spectator sports, and related industries subsector likewise contracts, projected to recede by just 80 jobs over the decade. The combined job losses of these two subsectors (-9,760) is only partially offset by job additions in the remaining three subsectors (+2,270). Accommodation, including hotels and motels contributes roughly half of that offset (+1,030).
Michigan’s remaining three industry supersectors are projected to decline by less than 5,000 jobs each, including Information (-4,790); Public administration (-4,040);1 and Other services (except government) (-1,440). Although Information had the second lowest employment of all supersectors in 2024, it is projected to fall at the fastest pace (-8.5 percent).
More than Half of Michigan's Occupational Groups Predicted to Grow
Projections data not only estimate growth across industries but also by occupations based on the Standard Occupation Classification (SOC) system. This system categorizes jobs into over 850 standardized occupation titles based on factors such as work performed and the skills, education, and/or training needed to perform the work. These occupations are also grouped into one of 22 major occupational groups.
As with industries, Michigan's employment composition by occupational groups is largely expected to shift towards healthcare. Healthcare practitioners and technical (+0.6 percentage points) and Healthcare support (+0.5 percentage points) increase their share the most, so that by 2034 each will encompass 7.0 percent and 4.6 percent of Michigan employment, respectively. Management also gains 0.2 percentage points to reach a share of 7.7 percent. Conversely, occupations that perform Office and administrative support (-0.7 percentage points); Production (-0.6 percentage points); and Sales and related (-0.5 percentage points) tasks are predicted to experience the largest loss as a share of total employment.
Management Occupations Expected to Accompany Healthcare in Leading Michigan Occupational Job Growth
Healthcare-related occupations are projected to dominate employment gains in the state. Healthcare practitioners and technical occupations are predicted to add 28,610 jobs, with Healthcare support jobs close behind at 24,100. This places these groups first and second in job growth statewide, respectively. By rate of growth, the order reverses: Healthcare support occupations are expected to expand by 12.3 percent, while Healthcare practitioners and technical occupations are anticipated to grow by 9.3 percent, ranking them as the top two fastest‑growing occupational groups statewide.
Within Healthcare practitioners and technical, occupations with the largest predicted employment increases include Registered nurses (+9,030) and Nurse practitioners (+3,410). Physician assistants complete the top three list, with an expected increase of 1,300 positions. No occupations within the Healthcare practitioners and technical group are predicted to lose jobs during the projections period.
Similarly, most occupations in Healthcare support are projected to grow, with the exception of four occupations, which remain flat over the decade. Top growers in Healthcare support consist of the group's largest occupation by employment, Home health and personal care aides (+14,200); Medical assistants (+3,130); and Nursing assistants (+2,560). Home health and personal care aides also stands out as being the occupation projected to add the most jobs statewide.
Although not as pronounced as healthcare, Management occupations are predicted to experience strong growth (+12,120), continuing a trend recorded during the post-pandemic recovery. These employment additions are carried by Medical and health services managers (+4,010); Financial managers (+2,380); and Computer and information systems managers (+1,610). Combined, they represent about two-thirds of the net job growth of all Management occupations.
The same three major groups – Healthcare practitioners and technical; Healthcare support; and Management – are predicted to grow the most nationally in numeric terms. However, only Healthcare support (+12.4 percent) and Healthcare practitioners and technical (+7.2 percent) are in the top three by rate of growth, with Computer and mathematical placing second (+10.1 percent).
For further insights into which occupations are expected to contribute most to job growth in Michigan, see this month’s Relevant Rankings article.